You don’t need to be a technical genius to understand dashboard data visualization. Looking to learn how to create an effective dashboard? Go through the following tips for an effective data visualization dashboard.
Data visualization tools like graphs, charts, and dashboards help business leaders and managers monitor communication and project updates and make informed decisions that drive better business outcomes.
So, what does it take to create and manage more influential dashboard data visualization?
Dashboard data visualization tips
Here, we will discuss the non-technical tips to help leaders get started with best practices for data visualization.
Define the purpose
Start by defining the purpose of your data visualization. For instance, what questions are you trying to answer through interactive dashboards?
If you’re analyzing your marketing team’s data, consider asking the following questions.
- How is the marketing team performing against time?
- What are the best-selling products and offerings?
- How many leads has the team generated over a specific period?
Once you have the primary metrics you want to showcase in your data visualization, consider how these metrics and numbers will collectively convey a message relevant to making informed decisions for your target audience.
Choose the correct visualization types
Easily one of the biggest challenges for decision-makers and presenters.
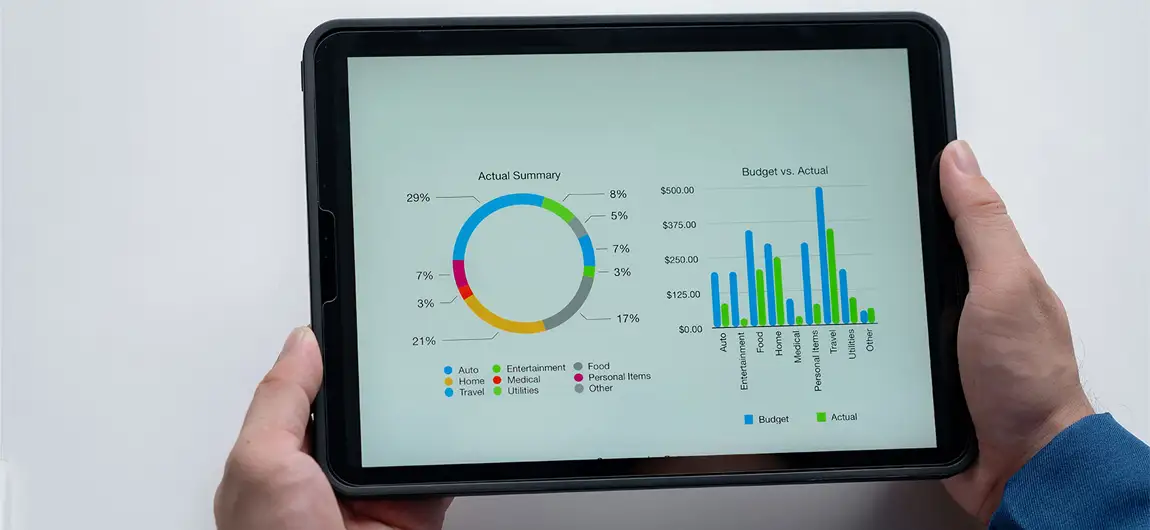
There are literally hundreds of data visualizations, including some common ones like graphs, charts, flowcharts, maps, tables, scatter plots, etc., that business owners can choose to create the perfect dashboards.
However, your dashboard designer’s job is to create a dashboard or data visualization that resonates with your audience’s preferences.
Whatever type you choose, be mindful of the following considerations: Is your data qualitative or quantitative? Are you showcasing trends, comparisons, relationships, dependencies, variables, etc.? Is regional information important?
Sorting the information will help you narrow down the types of data visualization you can use. If you’re still skeptical, experiment with one or more types to understand which visual corresponds best to your needs.
Keep it simple and intuitive
No one likes complex and overly cluttered visuals, let alone using visuals exhibiting significant business information.
A dashboard must be simple and easy to understand. Opt for a minimalistic design that allows users to obtain information at first glance.
On the other hand, a cluttered design is highly likely to frustrate the user, leading to their abandonment of the application.
A good data visualization or dashboard offers clarity and simplicity, an intuitive layout, relevant and accurate data, suitable use of visual elements and interactivity, and a responsive design.
Moreover, a great dashboard aims to allow accessibility, seamless performance, customization, and flexibility.
Add context
Context is the key! And if your audience cannot understand the relevancy of your data, they’ll likely miss out on important chunks needed to make important decisions.
Suppose a retail business wants to monitor its sales performance across different regions for December, or more precisely, the holiday season.
Apparently, the core dashboard features will include key metrics such as total sales, growth rate, average order value, etc.; various visual elements; filters based on sales data across different regions, product categories, and time periods; and prominent insights indicating elements, such as regions with the highest sales, product categories with declining sales, and improvement recommendations.
However, the context here is the holiday season, helping the team understand what data is included, how it is visualized, and what insights are significant.
The purpose is to create a tailored dashboard that meets the company’s demands for that particular period.
Further tips!
In addition to the ones above, the dashboard data visualization must incorporate consistent design elements, prioritize information, be responsive, use appropriate white spaces and a consistent layout, and be designed for speed.
Lastly, I would say that creating an effective data visualization dashboard doesn’t require technical expertise but rather a thoughtful approach to design and presentation.
By defining the purpose of your dashboard, selecting the suitable types of visualizations, keeping the design simple and intuitive, and adding necessary context, you can ensure that your dashboard communicates the intended message clearly and effectively.
Remember, a well-crafted dashboard empowers business leaders to make informed decisions by presenting data in an accessible and engaging way.
Focus on these non-technical tips; you’re ready to create dashboards that drive better business outcomes.
See More: 7 Key Strategies to Unlock Business Growth with Automation

